Introduction
In any cloud environment, particularly one with mission-critical workloads, monitoring and logging are essential. These processes ensure system health, optimize performance, and automate responses to events. The focus of this article is to walk through the practical implementation of monitoring, logging, and remediation using Amazon CloudWatch, AWS Systems Manager, and EventBridge.
We recently implemented a demonstration that monitored a single EC2 instance, created alerts based on resource utilization, and automated remediation actions using runbooks. Although this example centers around a single instance, the concepts apply to much more complex environments. Here’s a detailed account of the experience and the lessons learned.
Situation
In modern cloud infrastructures, monitoring and proactive remediation are non-negotiable to ensure reliability and performance. AWS provides various services like CloudWatch and Systems Manager to automate these tasks, making the infrastructure resilient and scalable.
For the demonstration, we used a single EC2 instance to monitor system health metrics (such as CPU usage) and automate remediation actions (like restarting the instance or archiving logs). The project aimed to cover key aspects of monitoring, logging, and remediation as outlined in the AWS Certified SysOps Administrator – Associate exam guide.
Task
The task was to set up an automated monitoring and remediation system for an EC2 instance, covering the following elements:
1. Implement metrics, alarms, and filters using AWS monitoring and logging services.
2. Collect and analyze logs using CloudWatch Logs and the CloudWatch agent.
3. Create alarms for metrics like CPU and memory usage.
4. Automate remediation actions like restarting the instance or archiving logs when thresholds were breached.
5. Configure EventBridge rule and Systems Manager Automation runbooks to automate actions based on Cloudwatch alarms.
Action
For this exercise, I just used a sample web application written in Flask/Python, which is just run on port 80 on the server where it is running, as I wanted to enable access on port 80 through Security Group. The idea was to learn Cloudwatch in general. Also to save some costs, I just used a single EC2 instance, in real world production environment, monitoring won’t be setup just for one single instance, but rather on a Load Balancer, Cluster of Servers/Auto Scaling Groups/large infrastructure setup. But as already mentioned, the purpose was to learn all the required topics for Cloudwatch & suite of services provided by AWS.
1. Metrics Collection with CloudWatch Agent
Install the CloudWatch Agent on your EC2 instances to collect system-level metrics (CPU, Memory, Disk I/O, etc.). Cloudwatch Agent installation can be found in the AWS Documentation link here.
Cloudwatch agent needs to run as a process on all the servers/hosts, which you want to monitor.
Custom Metrics: Configure the CloudWatch agent to collect custom metrics from your application, such as request count, error rates, or user sessions. In my case a sample python script to generate and send the custom metrics user_sessions is given below.
Show/Hide custom_metrics.py
import boto3
cloudwatch = boto3.client('cloudwatch')
# Example of sending a custom metric (e.g., UserSessions)
response = cloudwatch.put_metric_data(
    Namespace='MyCustomApp',
    MetricData=[
        {
            'MetricName': 'UserSessions',
            'Dimensions': [
                {
                    'Name': 'InstanceID',
                    'Value': 't2.micro'
                },
            ],
            'Unit': 'Count',
            'Value': 10.0
        },
    ]
)

print("Metric published!")
2. Logging with CloudWatch Logs and Logs Insights
Configure CloudWatch Logs: Send application and system logs to CloudWatch Logs. Ensure error logs and access logs are captured.
Use CloudWatch Logs Insights: Query the logs for specific error patterns, request rates, or abnormal behaviour, showing how to gain insights from logs.
3. Create CloudWatch Alarms
Create Alarms for Metrics: Set alarms for critical metrics (e.g., CPU usage > 75%, high memory usage, error count > threshold).
Create Alarms for Critical Metrics (Memory, Disk, CPU Usage)
You can create alarms that notify you when a threshold is breached. For instance, if memory usage exceeds 75% or disk usage exceeds 80%, you can receive an alert.
1. Go to CloudWatch Console → Alarms → Create Alarm.
2. Choose the Metric:
– Select your metric namespace (e.g., CWAgent).
– Choose the metric (e.g., mem_used_percent or disk_used_percent).
3. Set Conditions:
– Set the threshold condition, such as greater than 75% for memory usage or greater than 80% for disk usage.
4. Set Notification:
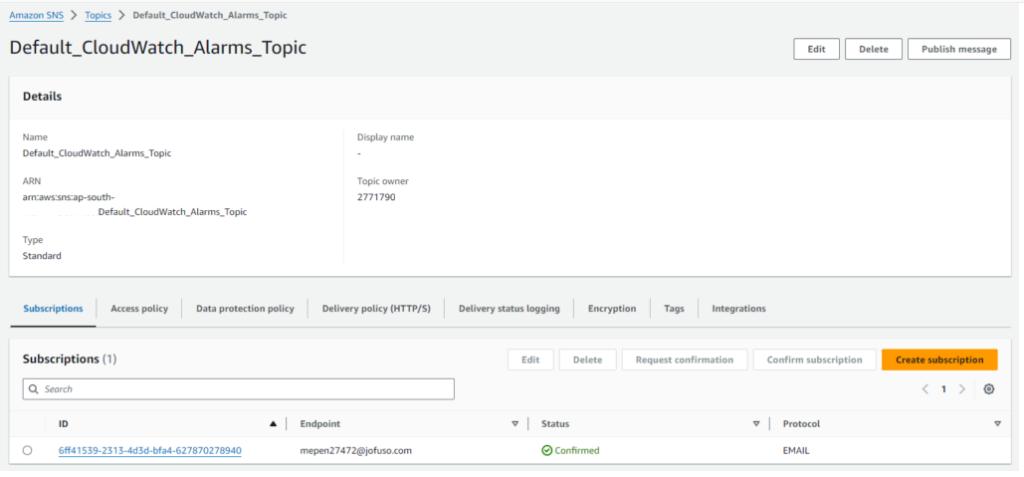
– You can configure an SNS (Simple Notification Service) topic to send notifications via email or SMS when the alarm triggers.
– If you haven’t created an SNS topic yet, create one from the SNS console and subscribe your email.
5. Add Actions:
– Configure actions that will take place when the alarm is triggered, such as sending an alert or triggering an EC2 instance restart.
6. Name and Create the Alarm.
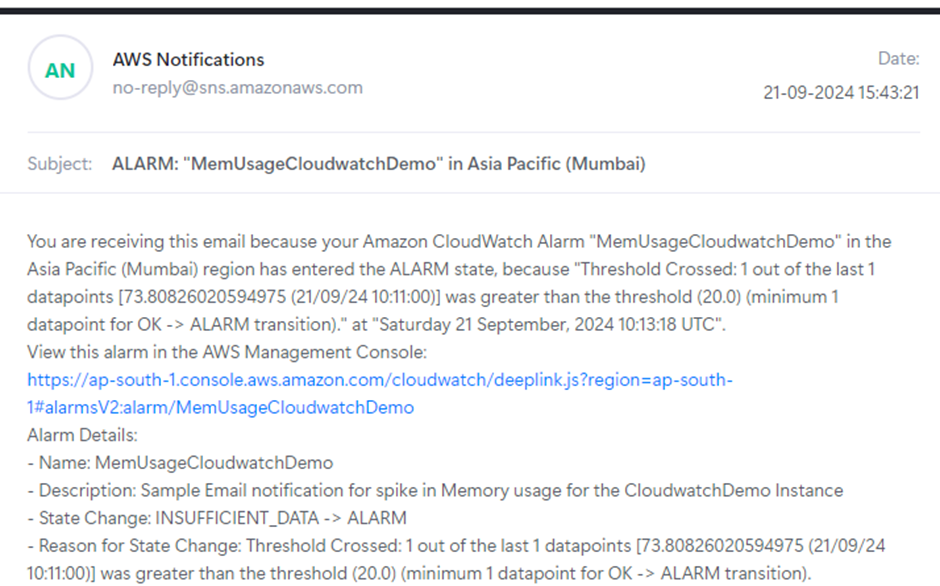
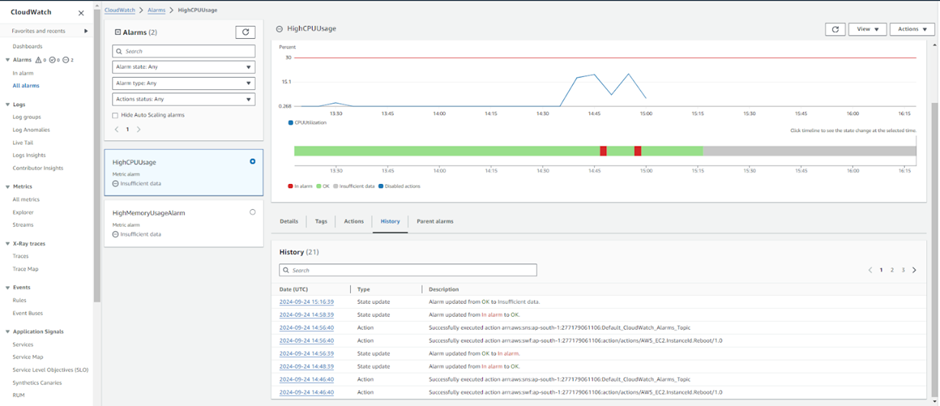
Alarms shown below were set for notifying through email if CPU Usage > 30% & Memory usage is > 40% on the EC2 server.
Thresholds for Alerts: Create thresholds for each alarm, and show how alarms can trigger actions based on certain thresholds.

4. Create Metric Filters
Define Metric Filters: Use CloudWatch Logs to create metric filters that can track specific patterns in your logs (e.g., certain error messages or HTTP 500 responses). In my case I created a log group for storing the logs of the execution of the automation runbook that was created for the Log Archival part, more details in the Remediation section below. Basically, Log groups can be used to store & maintain the log files which you would want to analyze for analysis of the application specific messages/errors/exceptions using metric filters.
Create Metric Filters for Logs
You can create metric filters in CloudWatch Logs to trigger alarms based on specific log patterns, such as HTTP 500 errors or specific error messages in your logs.
1. Go to CloudWatch Console → Logs → Log Groups.
2. Select the Log Group (e.g., MyAppLogs).
3. Create Metrics Filter:
– In the Actions drop-down, choose Create Metric Filter.
– Define a filter pattern, for example, ERROR or a custom error pattern that exists in your logs.
– Choose a metric to associate with this pattern, such as ErrorCount.
4. Set a filter name and log metric.
5. CloudWatch Dashboards
Create Dashboards: Build a CloudWatch dashboard that displays the metrics of your EC2 instance, including system metrics, custom application metrics, and alarm states.
Now, you can create a CloudWatch dashboard to visualize all the critical metrics and alarms for your EC2 instance.
You can add different types of visualizations, such as line graphs for usage metrics and gauge widgets for alarms.
Go to CloudWatch Console → Dashboards → Create Dashboard.
Name your dashboard and choose a widget type (e.g., Line graph, Gauge, etc.).
Add Metrics:
Add the system metrics like mem_used_percent, disk_used_percent, and your custom application metrics (like UserSessions).
You can also add Alarms to the dashboard for an easy overview.
Customize the Dashboard:
6. Configure Notifications with SNS
Setup SNS Notifications: Configure SNS to send alerts based on CloudWatch alarms (e.g., send an email or SMS when an alarm triggers).

Example Notification: When the CPU usage exceeds a certain percentage, send an alert to the application support team.

7. Remediation with EventBridge and AWS Systems Manager
EventBridge for Automated Actions:
Scenario 1: Spike in CPU Usage – Restart EC2
Steps:
1. Create a CloudWatch Alarm for CPU Usage Spike:
– Go to CloudWatch > Alarms and create an alarm for high CPU usage (e.g., CPU usage > 75% for 5 minutes).
– Set up the alarm to “In Alarm” when the threshold is crossed.
2. Create EventBridge Rule:
– Go to Amazon EventBridge > Rules and click Create rule.
– Give it a name, e.g., RestartEC2OnHighCPU.
– Select Event Source as AWS and Event Pattern.
– Choose the CloudWatch Alarms service, then select the state ALARM.
– For Target, select EC2 instance.
– Choose Restart instances as the action.
– Choose the appropriate EC2 instance (the instance you’re monitoring) and configure.
3. Test the Setup:
– To simulate high CPU usage, you can use the stress command in your EC2 instance as before.
– Once the CPU crosses the threshold, the CloudWatch alarm should trigger, and EventBridge will automatically restart the instance.
Systems Manager Runbook for Scenario 1
For the first scenario, EventBridge takes care of restarting the instance, so you don’t need a Runbook. However, you could use a Systems Manager Runbook if you want more control or additional remediation steps.
Systems Manager Runbooks:
– AWS Systems Manager Automation Runbooks can be used to execute predefined scripts for remediation.
– Set up a CloudWatch Alarm that triggers the EventBridge rule, which then invokes the Systems Manager runbook.
– You can use an existing runbook like AWS-StopEC2Instance or create a custom one for specific tasks.


Scenario 2: Clearing Logs and Zipping Files over 100MB
Systems Manager Runbook
In this scenario, we will create a Systems Manager Automation document (Runbook) that clears a folder and zips files over 100MB.
Steps:
1. Create a Custom Systems Manager Automation Document:
– Go to AWS Systems Manager > Documents.
– Click Create Document and choose Automation as the document type.
– Name the document, e.g., ClearAndZipLogs.
– Under Content, write a custom script (given below):
– Check for files over 100MB in a specified folder.
– Zip those files.
– Move the zipped files into archive folder
Show/Hide Automation Script code
schemaVersion: '0.3'
assumeRole: arn:aws:iam:::role/SSMRunbookLogManagementRole
description: This is a runbook for the Housekeeping task of archiving the log files over 100 MB in the /web-app/ folder & into the /web-app/archive/
mainSteps:
  - name: AWS_RunShellScript
    action: aws:runCommand
    isCritical: false
    isEnd: true
    inputs:
      DocumentName: AWS-RunShellScript
      Parameters:
        commands:
          - '#!/bin/bash'
          - log_directory="/home/ec2-user/web-app/logs/"
          - archive_directory="/home/ec2-user/web-app/logs/archive/"
          - ''
          - '# Log the start of the archival process'
          - echo "Starting log archival process" | tee -a /var/log/archival.log
          - ''
          - '# Find and zip files larger than 100MB'
          - echo "Zipping files larger than 100MB in $log_directory" | tee -a /var/log/archival.log
          - find "$log_directory" -type f -size +100M -exec gzip {} \; | tee -a /var/log/archival.log
          - ''
          - '# Move zipped files to the archive folder'
          - echo "Moving zipped files to $archive_directory" | tee -a /var/log/archival.log
          - mv "$log_directory"*.gz "$archive_directory" | tee -a /var/log/archival.log
          - ''
          - '# Delete older logs (optional step, deletes logs older than 30 days)'
          - echo "Deleting logs older than 30 days from $log_directory" | tee -a /var/log/archival.log
          - find "$log_directory" -type f -mtime +30 -exec rm {} \; | tee -a /var/log/archival.log
          - ''
          - '# Log the end of the process'
          - echo "Log archival process completed" | tee -a /var/log/archival.log
          - ''
        executionTimeout: '3600'
      InstanceIds:
        - i-027b70036e16e6776
      CloudWatchOutputConfig:
        CloudWatchLogGroupName: /aws/ssm/ClearAndZipLogs
        CloudWatchOutputEnabled: true
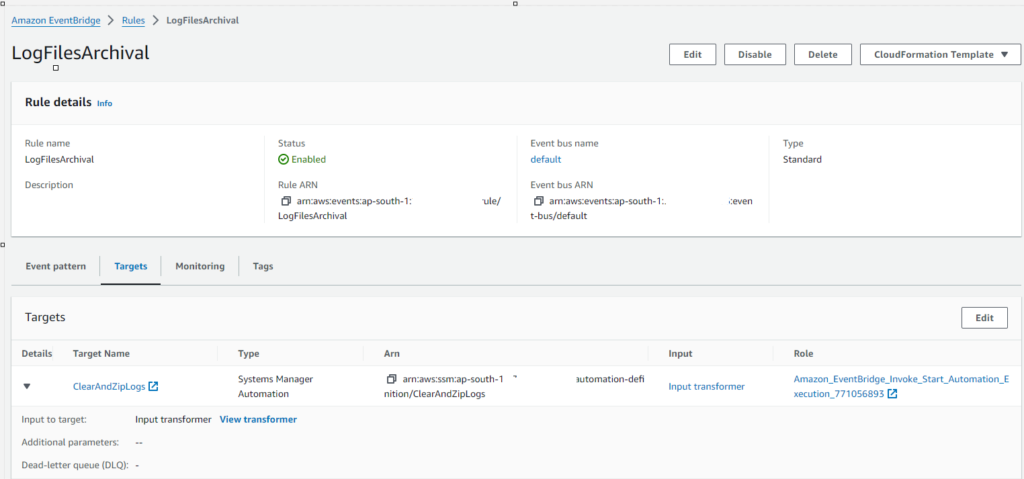
2. Create an EventBridge Rule:
– Go to EventBridge > Rules and create a rule to monitor for log growth or disk usage (can use a custom CloudWatch alarm based on file system space or log size).
– Set the event source as CloudWatch Alarm or custom metric.
– For Target, choose Systems Manager Automation and select your custom document ClearAndZipLogs.
– Configure permissions if necessary.
3. Test the Setup:
– You can simulate the creation of large logs by generating test files over 100MB in the specified directory.
– The automation will execute and zip large files, clearing the log folder as expected.


Result
The system performed successfully, achieving the following results:
– We automated the monitoring of system health using CloudWatch, ensuring real-time alerts for performance issues.
– Critical metrics like CPU and memory usage were continuously monitored, and alarms were triggered when thresholds were exceeded.
– EventBridge rules successfully triggered automation runbooks that restarted the EC2 instance and archived log files over 100MB, improving system uptime and resource management.
– CloudWatch Logs and Log Insights allowed us to capture, store, and query application logs, making troubleshooting significantly easier.
The automation workflow ensured minimal manual intervention, demonstrating how AWS tools can help improve system resilience and streamline infrastructure management.
Learnings:
Following issues were faced during this entire exercise & were resolved.
1.Issue: Custom Metrics generation python script was unable to send the custom metrics to Cloudwatch agent.
Resolution: Created a new IAM role named “EC2CloudWatchAgentRole”, having the policies CloudWatchAgentServerPolicy & CloudWatchLogsFullAccess, attached to it. This IAM role was then attached to the EC2 instance which runs the web application.
2. Issue: Although threshold situation of increased CPU usage was achieved, alarm was not getting triggered.
Resolution: Metric Name(Custom metric in this case, named “mem_used_percent”) was changed to “Memory Usage(%)” or “Memory Usage(Percent)” & alongwith this the instance id value was also changed to “CloudWatchDemoInstance”, this caused the issue.
3. Issue: The SSM Runbook failed to execute due to insufficient permissions for the assumed role.
Resolution: The trust relationship of the IAM role was updated to allow ssm.amazonaws.com in addition to ec2.amazonaws.com, and the IAM policy was extended to include the necessary permissions, such as ssm:SendCommand, ssm:ListCommandInvocations, and ssm:DescribeInstanceInformation.
4. Issue: Automation Step Execution Failed due to SSM Agent availability check.
Resolution: The Amazon SSM Agent was found to be inactive or not responding. After starting the SSM agent on the EC2 instance (sudo systemctl start amazon-ssm-agent), the automation was able to proceed.
5. Issue: Access Denied for ListCommandInvocations during SSM Automation Execution.
Resolution: Updated the IAM Role (SSMRunbookLogManagementRole) to include the necessary permissions for ssm:ListCommandInvocations, which allowed the automation to verify command completion.
6. Issue: Step timed out while verifying SSM Agent on EC2 instance.
Resolution: This was caused by an issue with SSM Agent credentials. Restarting the instance and ensuring that the IAM role attached to the instance had the necessary policies resolved the issue.

