Introduction
The Importance of Observability in Modern Applications:
In today’s digital landscape, applications are expected to perform seamlessly at all times. Downtime or performance degradation can lead to a loss of users and revenue. This is where observability comes into play. Observability provides deep insights into the state of an application, allowing teams to monitor, troubleshoot, and optimize their applications in real-time.
What is Observability? Observability is the ability to measure the internal state of a system based on the data it generates, such as logs, metrics, and traces. It goes beyond traditional monitoring by providing deep insights into system behaviour, allowing teams to detect, diagnose, and resolve issues quickly.
Why Observability is Crucial:
- Proactive Issue Detection: Observability tools help in identifying potential issues before they impact users.
- Faster Incident Resolution: With proper observability, you can quickly pinpoint the root cause of issues.
- Improved System Reliability: Continuous monitoring and observability ensure that systems perform optimally, reducing downtime and improving user experience.
- Data-Driven Decisions: Observability provides the data needed to make informed decisions about scaling, performance tuning, and infrastructure investments.
Popular Observability Tools:
- Prometheus: A powerful metrics collection and alerting toolkit.
- Grafana: A versatile visualization tool to create dynamic dashboards.
- Alertmanager: A tool for handling alerts generated by Prometheus.
Why Choose Prometheus?
Prometheus has emerged as a leading tool in the observability space, particularly for monitoring cloud-native applications. Here’s why:
Advantages of Prometheus:
- Time-Series Database: Prometheus is built around a time-series database, making it ideal for storing and querying high-cardinality data.
- Powerful Query Language (PromQL): Prometheus’s query language, PromQL, is powerful and flexible, allowing you to create complex queries for monitoring and alerting.
- Built for Cloud-Native: Prometheus integrates seamlessly with Kubernetes and other cloud-native technologies.
- Open Source & Extensible: It’s open source, with a vibrant community, and can be extended through exporters to monitor almost anything.
- Multidimensional Data Model: Prometheus’s data model allows for multi-dimensional data collection, making it versatile for different use cases.
Alternatives to Prometheus:
While each of these tools has its strengths, Prometheus stands out due to its native support for dynamic cloud environments and its powerful query capabilities.
Situation
In our initial setup, we deployed a video streaming application across two self-managed instances on Google Cloud Platform (GCP). Each instance handled incoming video streams, distributing them to users. While the application was functional, we faced significant challenges due to the lack of proper observability:
1. Missed Alerts: Without a robust monitoring system, key performance metrics such as CPU and memory usage were not being tracked effectively. This lack of monitoring meant that critical issues often went undetected until they escalated, causing performance degradation and impacting the user experience.
2. Inability to Track Application Performance: The absence of real-time data made it difficult to understand how the application was performing, especially during peak traffic periods. As a result, we couldn’t proactively address bottlenecks or optimize resource usage, leading to potential downtime or slow service during high-demand scenarios.
3. Operational Blind Spots: We were essentially operating in the dark, with no clear visibility into the health of our infrastructure or the application itself. This limited our ability to diagnose and troubleshoot issues promptly, risking prolonged outages and user dissatisfaction.
Initial Setup Diagram: To visually represent this initial scenario, the diagram below shows two compute instances running the video streaming application. Users connect to the application without any form of observability, leaving performance metrics and potential issues hidden from view.

Task
To address these challenges, we set out to implement an observability solution using Prometheus and Grafana. Our primary goal was to enhance the reliability and performance of the video streaming application by gaining real-time insights into critical system metrics.
Objective:
Our initial objective was to set up Prometheus as a metrics collector for key parameters like CPU usage, memory usage, disk space, and network traffic. These metrics are vital for understanding the health and performance of the application, allowing us to identify and respond to issues before they impact the user experience.
Establishing Alerting Mechanisms:
A key part of our task was to configure alerting through Prometheus and Alertmanager. By setting up alerts for high CPU or memory usage, we aimed to ensure that critical issues are detected and communicated promptly, enabling swift corrective actions.
Key Metrics to Monitor:
- CPU Usage: High CPU usage can indicate that the system is under heavy load, potentially leading to performance bottlenecks.
- Memory Usage: Monitoring memory usage helps in detecting memory leaks or overconsumption, which can cause application crashes or slowdowns.
- Disk Space: Keeping track of available disk space is crucial to prevent unexpected application failures due to full disks.
- Network Traffic: Observing network traffic patterns helps in understanding user behavior and detecting unusual activity that could signal potential problems.
By setting up observability with Prometheus and Grafana, our aim was to not only monitor the current state of the application but also to build a foundation for future scaling efforts. This observability layer would provide the data necessary to make informed decisions about scaling, load balancing, and eventually moving towards more advanced setups like Kubernetes and Horizontal Pod Autoscaling (HPA).
Action
Implementing Observability with Prometheus and Grafana
Setting Up Prometheus:
- Installation: Download and install Prometheus on both self-managed instances.
Show/Hide Installation steps
sudo apt update -y
sudo wget https://github.com/prometheus/prometheus/releases/download/v2.54.1/prometheus-2.54.1.linux-amd64.tar.gz
sudo tar xvf prometheus-2.54.1.linux-amd64.tar.gz
sudo useradd --no-create-home --shell /bin/false prometheus
sudo mkdir /etc/prometheus
sudo mkdir /var/lib/prometheus
sudo chown prometheus:prometheus /etc/prometheus
sudo chown prometheus:prometheus /var/lib/prometheus
sudo mv prometheus-2.54.1.linux-amd64 prometheuspackage
sudo cp prometheuspackage/prometheus /usr/local/bin/
sudo cp prometheuspackage/promtool /usr/local/bin/
sudo chown prometheus:prometheus /usr/local/bin/prometheus
sudo chown prometheus:prometheus /usr/local/bin/promtool
cp -r prometheuspackage/consoles /etc/prometheus
cp -r prometheuspackage/console_libraries /etc/prometheus
chown -R prometheus:prometheus /etc/prometheus/consoles
chown -R prometheus:prometheus /etc/prometheus/console_libraries
vim /etc/prometheus/prometheus.yml
global:
  scrape_interval: 10s

scrape_configs:
  - job_name: 'prometheus_master'
    scrape_interval: 5s
    static_configs:
      - targets: ['localhost:9090']

	  chown prometheus:prometheus /etc/prometheus/prometheus.yml


vim /etc/systemd/system/prometheus.service

[Unit]
Description=Prometheus
Wants=network-online.target
After=network-online.target

[Service]
User=prometheus
Group=prometheus
Type=simple
ExecStart=/usr/local/bin/prometheus \
--config.file /etc/prometheus/prometheus.yml \
--storage.tsdb.path /var/lib/prometheus/ \
--web.console.templates=/etc/prometheus/consoles \
--web.console.libraries=/etc/prometheus/console_libraries

[Install]
WantedBy=multi-user.target


systemctl daemon-reload
systemctl start prometheus
systemctl status prometheus
Click to see prometheus.yml file config
# my global config
global:
  scrape_interval: 15s # Set the scrape interval to every 15 seconds. Default is every 1 minute.
  evaluation_interval: 15s # Evaluate rules every 15 seconds. The default is every 1 minute.
  # scrape_timeout is set to the global default (10s).

# Alertmanager configuration
alerting:
  alertmanagers:
    - static_configs:
        - targets:
           - 'localhost:9093'

# Load rules once and periodically evaluate them according to the global 'evaluation_interval'.
rule_files:
   - "rules.yml"
  # - "second_rules.yml"

# A scrape configuration containing exactly one endpoint to scrape:
# Here it's Prometheus itself.
scrape_configs:
  # The job name is added as a label `job=` to any timeseries scraped from this config.
  - job_name: "prometheus"

    # metrics_path defaults to '/metrics'
    # scheme defaults to 'http'.

    static_configs:
      - targets: ["localhost:9090"]

  - job_name: 'video_streaming_app'
    static_configs:
      - targets: ['10.190.0.2:3001']
        labels:
          instance_name: "Stream-Inst-01"

  - job_name: 'node_exporter'
    static_configs:
      - targets: ['10.190.0.2:9100']
        labels:
          node_label: "Stream-Inst-01"

Click here to see alerts.rules.yaml file contents
groups:
- name: instance-health
  rules:
  - alert: InstanceDown
    expr: up == 0
    for: 1m
    labels:
      severity: critical
    annotations:
      summary: "Instance  {{ $labels.instance_name }} ({{ $labels.instance }}) is down \n"
      description: "The instance {{ $labels.instance_name }} is down for more than 1 minute.\n"

  - alert: HighCPUUsage
    expr: 100 - (avg by (instance) (rate(node_cpu_seconds_total{mode="idle"}[2m])) * 100) > 75
    for: 1m
    labels:
      severity: critical
    annotations:
      summary: "High CPU Usage on  {{ $labels.instance }} \n"
      description: "CPU usage is above 75% for more than 2 minutes on {{ $labels.instance }}.\n"

  - alert: HighMemoryUsage
    expr: (node_memory_MemTotal_bytes - node_memory_MemAvailable_bytes) / node_memory_MemTotal_bytes * 100 > 75
    for: 1m
    labels:
      severity: warning
    annotations:
      summary: "High Memory Usage on  {{ $labels.instance_name }} ({{ $labels.instance }})\n"
      description: "Memory usage is above 75% for more than 2 minutes on {{ $labels.instance_name }}.\n"

  - alert: HighSwapUsage
    expr: (node_memory_SwapTotal_bytes - node_memory_SwapFree_bytes) / node_memory_SwapTotal_bytes * 100 > 50
    for: 2m
    labels:
      severity: warning
    annotations:
      summary: "High Swap Memory Usage on  {{ $labels.instance_name }} ({{ $labels.instance }})\n"
      description: "Swap memory usage is above 50% for more than 2 minutes on {{ $labels.instance_name }}.\n"

  - alert: HighDiskUsage
    expr: (node_filesystem_size_bytes{mountpoint="/"} - node_filesystem_free_bytes{mountpoint="/"}) / node_filesystem_size_bytes{mountpoint="/"} * 100 > 80
    for: 5m
    labels:
      severity: warning
    annotations:
      summary: "High Disk Usage on  {{ $labels.instance_name }} ({{ $labels.instance }})\n"
      description: "Disk usage on / is above 80% for more than 5 minutes on {{ $labels.instance_name }}.\n"

  - alert: HighNetworkTraffic
    expr: rate(node_network_receive_bytes_total[1m]) > 1000000000 or rate(node_network_transmit_bytes_total[1m]) > 1000000000
    for: 2m
    labels:
      severtiy: warning
    annotations:
      summary: "High Network traffic on  {{ $labels.instance_name }}({{ $labels.instance }})\n"
      description: "Network traffic on {{ $labels.instance_name }} is above 1GB/s for more than 2 minutes.\n"

  - alert: HighErrorRate
    expr: sum(rate(http_requests_total{status=~"5.."}[5m])) by (instance) > 0
    for: 5m
    labels:
      severity: critical
    annotations:
      summary: "High Error Rate on {{ $labels.instance_name }}({{ $labels.instance }}) \n"
      description: "Instance {{ $labels.instance_name }} is experiencing a high rate of 5xx errors.\n"


  - alert: HighLatency
    expr: histogram_quantile(0.95, sum(rate(http_request_duration_seconds_bucket[5m])) by (le)) > 1
    for: 5m
    labels:
      severity: warning
    annotations:
      summary: "High Latency on {{ $labels.instance_name }} ({{ $labels.instance }})\n"
      description: "95th percentile latency on {{ $labels.instance_name }} has exceeded 1 second.\n"
Show/Hide Installation steps
Complete the following steps to install Grafana from the APT repository:
Install the prerequisite packages:
sudo apt-get install -y apt-transport-https software-properties-common wget

#####Import the GPG key:
sudo mkdir -p /etc/apt/keyrings/
wget -q -O - https://apt.grafana.com/gpg.key | gpg --dearmor | sudo tee /etc/apt/keyrings/grafana.gpg > /dev/null

### To add a repository for stable releases, run the following command:
echo "deb [signed-by=/etc/apt/keyrings/grafana.gpg] https://apt.grafana.com stable main" | sudo tee -a /etc/apt/sources.list.d/grafana.list

###### To add a repository for beta releases, run the following command:
echo "deb [signed-by=/etc/apt/keyrings/grafana.gpg] https://apt.grafana.com beta main" | sudo tee -a /etc/apt/sources.list.d/grafana.list

###### Run the following command to update the list of available packages:
# Updates the list of available packages
sudo apt-get update

###### To install Grafana OSS, run the following command:
# Installs the latest OSS release:
sudo apt-get install grafana

###### To install Grafana Enterprise, run the following command:
# Installs the latest Enterprise release:

sudo apt-get install grafana-enterprise
Access the Grafana web interface through {Instance_IP}:3000 and log in with default credentials.

Add Prometheus as a data source in Grafana. Create custom dashboards to visualize key metrics, such as CPU usage, memory usage, and disk space utilization. Set up panels and queries in Grafana to provide visual insights into the application’s performance.


Establishing Alerting Mechanisms:
Integrating Alertmanager:
Configure Alertmanager to work with Prometheus by specifying routes and receivers in alertmanager.yml.
Set up Slack notifications for critical alerts by adding the Slack webhook URL to the Alertmanager configuration.
Show/Hide alertmanager.yml file
global:
  resolve_timeout: 5m

route:
  receiver: 'slack-notifications'

receivers:
  - name: 'slack-notifications'
    slack_configs:
      - api_url: 'https://hooks.slack.com/services/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'
        channel: '#streaming-app-monitoring'
        send_resolved: true
        text: >
          *Alert:* {{ .CommonAnnotations.summary }}
          *Description:* {{ .CommonAnnotations.description }}
          *Instance:* {{ .CommonLabels.node_label }} ({{ .CommonLabels.instance }})
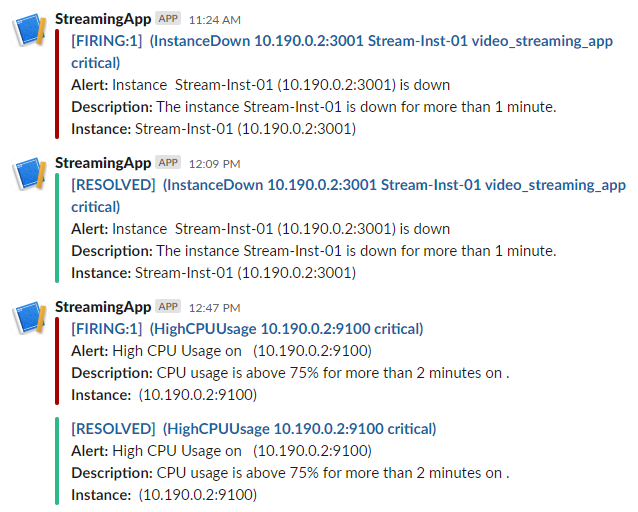
Sample screenshots shown below are from the Slack Channel StreamingApp which was configured to send an alert from the alertmanager of Prometheus.

Result
Observability Insights and Next Steps
Insights Gained:
The observability setup allowed you to monitor real-time metrics of the video streaming application, identifying peak CPU usage during high traffic periods.
Alerts were successfully triggered and sent to Slack, enabling proactive management of performance issues before they escalated.
Actions Taken:
Based on the insights from the observability setup, you decided to introduce load balancers to distribute traffic more effectively across instances.
The data gathered through Prometheus and Grafana provided the foundation for planning future scaling, such as moving to Kubernetes with Horizontal Pod Autoscaling (HPA).
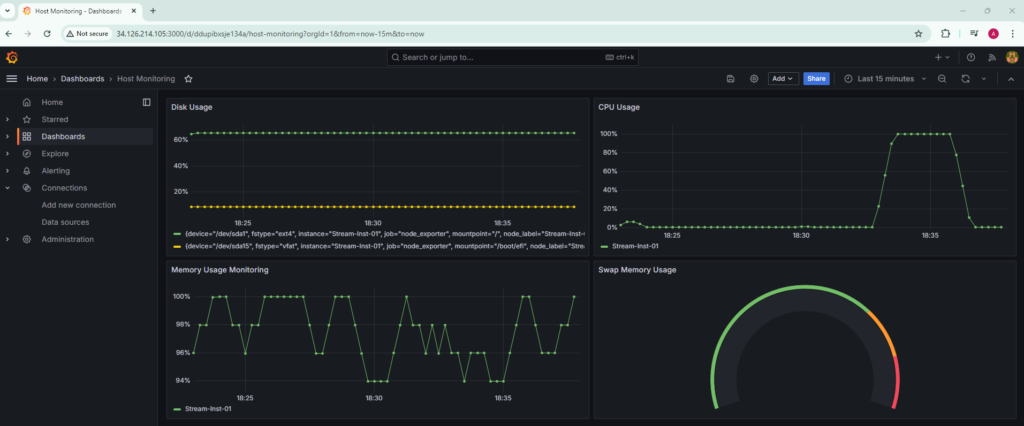
Screenshots shown below are from the Grafana Dashboard.
Host Level Monitoring Dashboard
-
Disk Usage:
Query: label_replace( 100 – (node_filesystem_free_bytes{mountpoint!~”/run/.*|/sys/.*|/proc/.*|/dev/.*”, fstype!~”tmpfs|devtmpfs”} / node_filesystem_size_bytes{mountpoint!~”/run/.*|/sys/.*|/proc/.*|/dev/.*”, fstype!~”tmpfs|devtmpfs”}) * 100, “instance”, “Stream-Inst-01”, “instance”, “.*” ) -
CPU Usage:
Query: label_replace( 100 – (avg by(instance) (rate(node_cpu_seconds_total{mode=”idle”}[1m])) * 100), “instance”, “Stream-Inst-01”, “instance”, “.*” ) -
Memory Usage Monitoring
Query: label_replace( 100 – (avg by(instance) (rate(node_memory_MemAvailable_bytes[1m]) / node_memory_MemTotal_bytes) * 100), “instance”, “Stream-Inst-01”, “instance”, “.*” ) -
Swap Memory Usage Monitoring
Query: label_replace( (rate(node_memory_SwapTotal_bytes[1m]) – rate(node_memory_SwapFree_bytes[1m])) / rate(node_memory_SwapTotal_bytes[1m]) * 100, “instance”, “Stream-Inst-01”, “instance”, “.*” )

